Years ago I had a teacher who would always say: “If the people who play the lottery were trained in statistics, they would stop buying tickets.”
The truth is that we are all more or less aware of the low probability we have of winning when we buy a lottery ticket, but since the cost and risks are low, we don’t worry about it too much.
What are the odds of us winning the lottery?
As we can see the probability of winning is really very low.
When we stock new products in our warehouse, in a way, its like we’re buying a lottery ticket. Will it be a high turnover product? Will it sell soon?
The difference is that in this auto parts lottery, the prizes are rewarded every minute (each time a customer requests a part) and the risk in this case is twofold:
1. Having tickets (products) that hardly ever win. Obsolete products.
2. Not having tickets (products) that are often winners. Lost sales.
As we all like winning, let’s see how we can make sure that our warehouse is full of winning tickets (products) and get rid of all those that only win once a year or not at all!
Curiously, in the auto parts lottery every month new numbers appear and at the same time others disappear forever, without warning us!
How many tickets are we talking about? How often do the different tickets win?
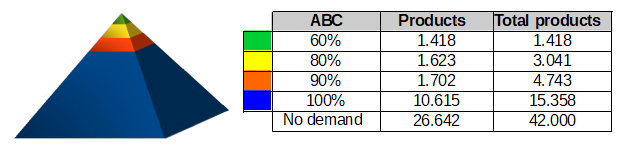
This would be the distribution pyramid for the number of tickets (products) and how often they win for starters and alternators throughout Europe in 2018:
Type A products win 60 out of 100 prizes, type A and B together, 80 out of 100 prizes, etc. If we want to win every time we need to have 15,358 products. Finally we can also see that there are 26,642 products that never win.
Spotting the type A or B winning tickets is very easy, they are always demanded by customers, so it won’t be long before we detect them! Here the competition is fierce because everyone has them, price and delivery time are key factors.
However, the risks go up when we want to expand our service to include type C or D products as finding the right product becomes much more difficult.
We can always hope that in the future a product may become a type A or B, but there’s no guarantee, and in the meantime, our assets will be sleeping on the shelf and we will miss out a lot of products with sales potential.
A demand analysis system help us to find out what kind of products we have in stock (A, B, C, etc) and to identify all those interesting products we are lacking. So, based on our company’s strategy, we will be able to decide which products to stock and which not.
Market Expert: Demand-driven analysis platform for automotive aftermarket parts.